Do Council Estates Lead to an Increase in Crime? - Part 2
Part 2 - The Correlations
So to recap part 1 - we've created a grid of .5x.5 miles over England and Wales, and for each square got the number of postcodes (which is a proxy for building/population density), local authority owned properties and crimes from January to July 2018. I assumed that the greater the number of people/buildings in the area, the greater number of crimes, which is something I want to test in this part. In fact, there are three relationships to uncover - the one between the number of postcodes and crime, the one between the number of postcodes and local authority owned properties and lastly, the number of local authority owned properties to crime. I'll be going through these relationships one by one and providing some more information on the outliers to relate these numbers to the real world. Keep in mind that because LA owned properties might share a postcode (e.g. in the case of flats in a building), there may be more LA properties than postcodes in an area. I used R to run and plot linear regressions on the data, and this and the next part will be somewhat technical. Essentially what I'm looking at is the relationship between two numbers and how strong that relationship is - you can find a simple explanation here.
Number of Postcodes to Number of Crimes
So first the simplest correlation - that between postcode density and total crime. The orange line below represents the linear regression for the number of postcodes to the number of crimes for each square in the grid.
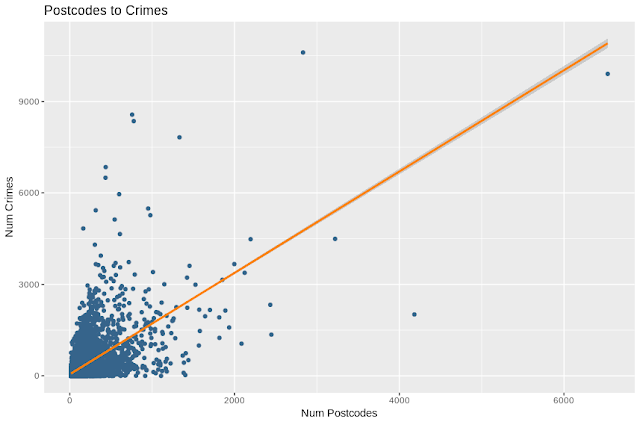

Relationship between the number of postcodes and number of crimes per half square mile
This is a fairly linear relationship, which means that as I had assumed, the total number of crimes is strongly related to the number of buildings/people in the area. (The R squared statistic is 0.365, meaning that 36.5% of the variability in crime in explained by the number of postcodes). Details of the regression below:
---
Signif. codes: 0 ‘***’ 0.001 ‘**’ 0.01 ‘*’ 0.05 ‘.’ 0.1 ‘ ’ 1
Residual standard error: 246.7 on 32001 degrees of freedom
Multiple R-squared: 0.3651, Adjusted R-squared: 0.365
We now want to look at the relationship between the number of local authority properties and crime, but before we do that we need to look at whether the number of local authority properties is also related to the number of postcodes. If council housing were perfectly distributed according to population density then we'd have no way of differentiating between the effect of population and that of council housing on crime.

Residual standard error: 15.81 on 32001 degrees of freedom
Multiple R-squared: 0.02048, Adjusted R-squared: 0.02045

The outlier on the other end is around Soho in London with 6,530 postcodes and 9 local authority owned properties (the dot to the upper left of the map)


---
Signif. codes: 0 ‘***’ 0.001 ‘**’ 0.01 ‘*’ 0.05 ‘.’ 0.1 ‘ ’ 1
Residual standard error: 300.5 on 32001 degrees of freedom

Coefficients:
| Estimate | Std. Error | t value | Pr(>|t|) | |
|---|---|---|---|---|
| (Intercept) | 53.42631 | 1.61159 | 33.15 | <2e-16 *** |
| Crime | 1.66213 | 0.01225 | 135.64 | <2e-16 *** |
Interestingly, the strongest relationship is for theft, followed by ASB and then violence. Put another way, the more buildings/people there are in an area, the higher the number of thefts. The correlations between the number of postcodes and crimes for individual crime types are (a correlation of 1 implies perfect correlation and 0 none)
| R-squared | Correlation | |
| Theft | 0.4026 | 0.6345 |
| Anti Social Bhvr | 0.2888 | 0.5373 |
| Violence | 0.2609 | 0.5108 |
| All | 0.3651 | 0.6042 |
We now want to look at the relationship between the number of local authority properties and crime, but before we do that we need to look at whether the number of local authority properties is also related to the number of postcodes. If council housing were perfectly distributed according to population density then we'd have no way of differentiating between the effect of population and that of council housing on crime.
Postcode Density to Number of Local Authority Properties
The distribution of local authority buildings among squares with similar postcode density is not even as you can see below. There are some sparsely populated places with several LA owned properties and some densely populated ones with hardly any.

Relationship between number of postcodes and number of council owned properties in each half square mileCoefficients:
Estimate
|
Std. Error
|
t value
|
Pr(>|t|)
| |
|---|---|---|---|---|
(Intercept)
|
2.7116637
|
0.1032568
|
26.26
|
<2e-16 ***
|
Local Authority
|
0.0203109
|
0.0007851
|
25.87
|
<2e-16 ***
|
So only 2% of variability in the number of LA owned properties is explained by the number of postcodes. The relationship is weak but exists, which means that the number of postcodes and number of local authority properties are not independent variables - that is, we couldn't say
crime = x + y*number of postcodes + z*number of council properties
The first outlier is an area south of Bristol that has 798 council owned properties in 84 postcodes (the dot to the lower right of the map)

Area with the highest density of council owned properties
The outlier on the other end is around Soho in London with 6,530 postcodes and 9 local authority owned properties (the dot to the upper left of the map)

Area with the lowest density of council owned properties
Local Authority Owned Properties to Crime
There is also a relationship between the number of LA owned properties and the number of crimes. Again, this might just be because of the combination of the two relationships shown above - the greater the number of postcodes, the greater the number of local authority buildings and the greater the number of crimes.

Relationship between the number of crimes and number of council owned properties per half sq mile
Coefficients:
| Estimate | Std. Error | t value | Pr(>|t|) | |
|---|---|---|---|---|
(Intercept)
|
147.4390
|
1.7340
|
85.03
|
<2e-16 ***
|
Crime
|
4.6676
|
0.1052
|
44.38
|
<2e-16 ***
|
Multiple R-squared: 0.05798, Adjusted R-squared: 0.05795
The outlier here again is the same area south of Bristol shown above that has 798 local authority properties but 566 crimes (the point on the far right side of the graph), while on the other end (top left of the graph) is the area around Covent Garden and Soho in London with 18 local authority owned properties but 5901 reported cases of theft and 2506 of anti-social behaviour.

Area with the highest number of crimes that has very few council owned properties
In the next part we'll put adjust for postcode density by using ratios rather than absolute numbers

Comments
Post a Comment