Do Council Estates Lead to an Increase in Crime? - Part 3
Part 3 - The Ratios
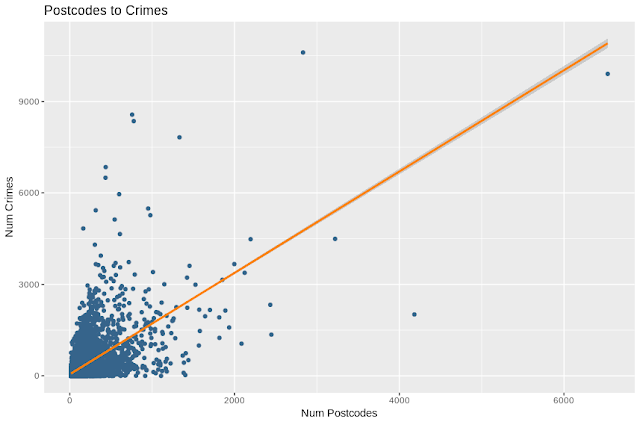
We saw in part 2 that there is a relationship between the number of postcodes (which is a proxy for the number of buildings/people) and the number of crimes as well as the number of local authority properties is a given square of the grid. What I want to do in this part is to remove the effect of the number of postcodes and isolate that of the number of council owned properties.
To do this I'll use the ratio of both the number of crimes and number of local authority owned properties to the number of postcodes in each square. This gives us a crime ratio and a local authority ratio, which expresses the density of each compared to the general population desity. By this measure, the most criminal place in the UK by this standard is Lindholme near Doncaster, with 16 postcodes but 494 violence and sexual offences, 45 cases of criminal damage and arson and 182 'other' crimes. This happens to be a prison so while accurate, subjectively its not very useful.
To do this I'll use the ratio of both the number of crimes and number of local authority owned properties to the number of postcodes in each square. This gives us a crime ratio and a local authority ratio, which expresses the density of each compared to the general population desity. By this measure, the most criminal place in the UK by this standard is Lindholme near Doncaster, with 16 postcodes but 494 violence and sexual offences, 45 cases of criminal damage and arson and 182 'other' crimes. This happens to be a prison so while accurate, subjectively its not very useful.
The second highest crime ratio is in Stratford in East London with 339 thefts of which 87 were thefts from the person, 134 were 'other thefts'. I've already excluded shoplifting because it skews crime rates in squares with shopping centres.

The area by Stratford Shopping Centre has the highest crime rate
Crime seems to be fairly evenly distributed in this area, not just limited to the shopping centre (the location pins show points where the police reported crimes), so this doesn't look like an outlier even though the presence of a shopping centre does skew the numbers. Unfortunately there isn't a way to adjust for opportunistic crime - theft at shopping centres, violence in prisons, etc.

Locations of crimes around the area by Stratford Shopping Centre
In part 1 we found that Newcastle and Leeds city centres had the highest number of anti-social behaviour and violent crimes respectively. Which places come out on top if we look at crime rates rather than raw numbers?
Looking at the ratio of anti social behaviour (ASB) to postcodes, two squares around Middlesbrough show up in the top 10, with the one in Hemlington (bottom left on the map below) being the highest and Normanby (centre right of the map below) the sixth highest.

Two areas near Middlesbrough are among the top ten for rates of anti-social behaviour
In Hemlington - this is the location that has the most reports of ASB (keeping in mind that crime locations are approximate)

Hemlington has the highest rate of anti-social behaviour in England and Wales
Drilling down into Normanby, this is the location that sees the most anti-social action

Normanby has the sixth highest rate of anti social behaviour in England and Wales
Neither one of these locations is owned by the local council.
The biggest commercial owner of properties in the square in Hemlington is Thirteen Housing Group Limited - a housing association, while in Normanby there is one property owned by a housing association and two council owned ones.
Coincidentally, Newcastle city centre which ranked first in the raw number of ASB incidents, ranks 8,553rd out of 32,001 squares when measured by ratio.
The Final Relationship
This is where it has all been leading to - the crime rate vs local authority rate, both adjusted for postcode density. This tells us, adjusted for population/building density what the impact on crime is for each additional council owned property.

Relationship between proportion of council owned properties to crime rate in each half square mile
Coefficients:
| Estimate | Std. Error | t value | Pr(>|t|) | |
|---|---|---|---|---|
(Intercept)
|
2.10603
|
0.01188
|
177.31
|
<2e-16 ***
|
Crime Ratio
|
1.25849
|
0.04442
|
28.33
|
<2e-16 ***
|
So, while there is a relationship between the local authority ratio and the crime ratio (every council owned property increases crime by 1.25 over 6 months), only 2.4% of the variation in crime rates is explained by the density of local authority buildings.
The strongest relationship is between anti social behaviour and local authority ratio at 2.6% followed by violence at 2.0% and theft at 0.9%.
None of these relationships is particularly strong, suggesting that while council owned buildings have some impact on crime, there are other factors that have a far stronger impact.
As an example, the number of properties owned by corporations explains 15% of the variance in crime in a given square - this may be because such areas have more people renting than owning or because they tend to be in urban areas.
As an example, the number of properties owned by corporations explains 15% of the variance in crime in a given square - this may be because such areas have more people renting than owning or because they tend to be in urban areas.

Relationship between proportion of company owned properties and crime rates in each half sq mile
Coefficients:


Estimate

Std. Error

t value

Pr(>|t|)


(Intercept)

1.44837

0.01449

99.93

<2e-16 ***


Crime Ratio

1.01140

0.01331

75.97

<2e-16 ***


---
Signif. codes:  0 ‘***’ 0.001 ‘**’ 0.01 ‘*’ 0.05 ‘.’ 0.1 ‘ ’ 1

Residual standard error: 1.92 on 32001 degrees of freedom
Multiple R-squared:  0.1528, Adjusted R-squared:  0.1528
In the next post, I plan to look at the relationship between crime rates and house prices.
Comments
Post a Comment