Do Council Estates Lead to an Increase in Crime? - Part 1
Part 1 - Gathering Data
Whenever I look for property, I'll have a walk around the area to see what kind of tenants I'm likely to get. I'll walk down the street and sometimes see an ominous looking tower block that was somebody's idea of a social experiment forty years ago that may or may not have gone horribly wrong. I don't know what the locals think of it, whether it impacts their life in any way or whether it might put off employed professional tenants. I live in London and am usually buying far from home, so other than data, my own impressions and the information I can gather online, I have no way of knowing anything about the area I'm buying into. I know not all council estates are not all bad (have a look here), that places like Park Hill in Sheffield that were once a byword for crime have had makeovers and that crime rates overall in the UK are dropping long term. If in fact people are put off buying near council estates but there is no discernible impact on living conditions nearby, then I'm quite happy to take advantage of their prejudice to get myself a good bargain. The problem then is to somehow quantify the impact of council estates on crime and to do this I worked with three sets of data -- The dataset on commercial ownership of property in England (available from HM Land Registry) - this includes not only all properties owned by limited companies but also includes properties owned by local authorities and housing associations.
- Data from the police website, which classifies and provides approximate coordinates of each reported crime.
- The ONS Postcode Directory that maps each postcode to coordinates - this gives me an approximation of the number of buildings in an area.
Methodology
Step 1 - Postcode Grid
I divided the UK into squares of .5 x .5 miles and then used ONS Postcode data to work out the number of postcodes in each square. I've limited the data to squares with more than 15 postcodes to avoid outliers like remote areas or motorway service stations where there may be high levels of reported crime but low population density. This covers a bit over 8,000 of the UK's approximately 93,000 square miles - specifically the areas shown below:

Areas of the UK that meet the threshold postcode desity
For example, zooming into south east London below, the threshold of 15 postcodes does a reasonable job of covering populated areas while avoiding the sides of bridges and highways, large parks, etc.

A close-up of South East London that shows areas that meet the minimum postcode density
And if you want an idea of what half a mile covers, here's a snippet of central London:

A further zoom-in on Central London showing an area of Hyde Park excluded from the data set
Step 2 - Local Authority Buildings
Commercial ownership data is only available for England and Wales - I've mapped out below the grid squares with local authority owned buildings from the Sept 2018 data set. No surprises here - there is a higher density (indicated by a darker shade of blue) in city centres. Local authority (LA) buildings include vacant land and schools. Schools seemed to make up about 2% of LA owned buildings based on a crude search of addresses with the word "school" in them. I'm working off the assumption that the vast majority of LA owned properties with postcodes are council housing (vacant plots of land don't have postcodes)

Density of Local Authority owned properties in England and Wales
Step 3 - Crime
The police release monthly statistics of crime around England with a location that is approximate to protect anonymity (read more under 'Location Anonymisation' here). For our purposes here, I'll assume that for the populated areas we're looking at, the police provided coordinates are accurate within a half mile. This is what the distribution of street crime in England looks like for the period between January and July 2018. Again, no surprises here - more densely populated areas have a higher rate of crime

Density of reported crimes around the UK
The police break down crimes into categories - I've given these a broader category. These are my categories based on statistics for July 2018
| Crime Type | No. of Crimes | My Category | |
| Anti-social behaviour | 137,799 | ASB | |
| Bicycle theft | 9,930 | Theft | |
| Burglary | 32,833 | Theft | |
| Criminal damage and arson | 49,849 | ASB | |
| Drugs | 11,076 | ASB | |
| Other crime | 8,881 | Omit | |
| Other theft | 48,805 | Theft | |
| Possession of weapons | 3,970 | Violence | |
| Public order | 42,984 | ASB | |
| Robbery | 6,978 | Theft | |
| Shoplifting | 30,028 | Omit | |
| Theft from the person | 8,716 | Theft | |
| Vehicle crime | 35,107 | Theft | |
| Violence and sexual offences | 166,579 | Violence |

The area with the highest number of reported crimes
The winner in the anti-social behaviour category with 3,825 crimes reported is the area around Newcastle train station

The area with the highest number of reported anti-social behaviour offences
While Leeds leads the violence category with 1,902 violent and sexual offences and 61 cases of possession of weapons in the city centre:

The area with the highest number of reported violent and sexual offences
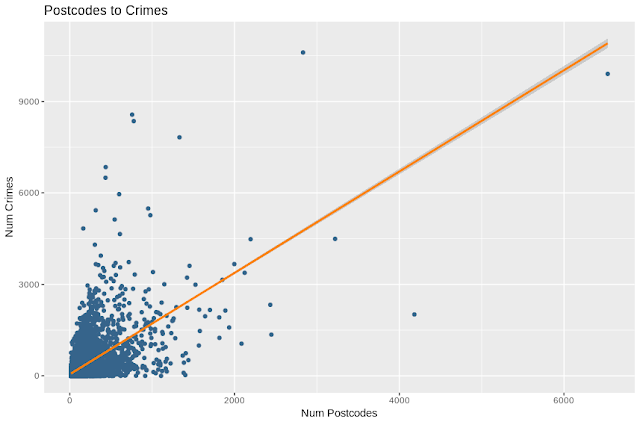
Of course a greater number of crimes will be reported in areas with a greater population density, so its no use just looking at the raw numbers. We'll get to that in Part 2.

Comments
Post a Comment